A UK SaaS scale-up signed us for observability implementation after six months of in-house attempt. Two engineers part-time, no observability, no audit log, a Confluence page with the runbook. The acquirer's CTO walked the codebase pre-LOI and said: “rip and replace, or a 25% diligence haircut.”
Service Observability implementation · OpenTelemetry + Datadog · UK senior-only studio
Observability implementation your on-call trusts. Not print statements in prod.
Observability for UK SaaS, fintech, and scale-up teams. Stop finding out a workflow died because the customer told you first — OpenTelemetry, Datadog / Grafana / Honeycomb, RED + USE metrics, and incident tooling your on-call reads at 3am.
24hreply, from a senior
200+projects shipped since 2019
Senioronly, on the spine
(Why CTOs sign for observability)
Observability implementation your on-call reads in 60 seconds. Twenty-two shipped. Senior engineers, plus the receipts your acquirer asks for.
Observability isn't a dashboard you buy. It's a product surface for your engineers, built so the trace tells them what happened before they finish their coffee.
0
0
5day
The CTO this page is for“rip + replace or 25% haircut” · full-team retention
Helena's product was good. Her platform floor was not. The acquirer walked it first.
The product wasn't the problem. The floor under it was. Helena had treated observability as a sprint someone would get to later. There were no traces, no structured logs, no SLO dashboards, and no way for on-call to know what happened when a workflow died.
We rebuilt over 10 to 14 weeks. Senior engineers paired daily. ADRs documented same day. The evidence pipeline was wired on Day 1. The acquirer's CTO came back, walked the same surface, and signed full-team retention. The deal closed at ask. This page is for the CTO who decided the platform is the product floor.
Observability as a product.
Eight things every implementation we ship has.
The signals your engineers need, wired the way Datadog and Honeycomb expect. Open any row.
Auto and manual instrumentation across every service. One wire format. Swap your backend later without touching the code that emits the signals.
Every log line is JSON with a trace ID, request ID, and tenant ID. Searchable, correlated, and useful at 3am instead of a wall of text.
Click a slow trace, jump to its logs. Read a scary log line, jump to its trace. One click each way, every time.
Rate, errors, duration for requests. Utilisation, saturation, errors for resources. The four signals that actually predict an incident.
SLOs your board understands. Error budgets your engineers spend on purpose. Burn-rate alerts before the budget is gone, not after.
Symptom-based alerts that page a human. Routing, escalation, and on-call rotation set up. No alert that doesn't have an owner and a runbook.
Observability bills spiral fast. Sampling, retention tiers, and cost tags per service. You see what each pipeline costs before the invoice does.
Every alert links to a runbook. Post-incident reviews blameless and templated. Your bus factor goes from one to four, documented in ADRs.
The pain. The day-1 observability architecture.
Each one is the difference between an on-call engineer who knows what happened and one who's guessing.
- 01
“A workflow died silently. The customer found out before we did.”
Per-workflow observability with symptom alerts. Health checks, RED metrics, and PagerDuty plus Slack alerts on every workflow. The customer never finds out first again.
- 02
“Production incident, and on-call has no idea what happened.”
Trace IDs end to end, structured logs correlated. On-call reads the trace and knows the cause in 60 seconds. Log-to-trace correlation means no more grepping log files under pressure.
- 03
“We get 200 alerts a night and we've stopped reading them.”
Symptom-based SLO alerts, every alert owned. We delete cause-based noise and alert on symptoms tied to SLOs. Burn-rate alerts page a human with a runbook attached, nothing else does.
- 04
“Our Datadog bill tripled and nobody knows which service did it.”
Sampling, retention tiers, cost tags per workload. Per-service cost attribution and budget alerts. We tune sampling and retention so the signal stays and the bill stabilises within 30 days.
- 05
“We're all-in on one vendor and switching means re-instrumenting everything.”
OpenTelemetry as the wire format. Your code emits OTel. The backend is a config change. Move from Datadog to Grafana to Honeycomb without touching instrumentation.
- 06
“Who did what, when? No record. The SOC 2 auditor flagged it.”
Audit log per mutation, tenant-admin viewable. Every mutation logged with actor and timestamp. The auditor is satisfied, and so is the acquirer's CTO on the diligence call.
- 07
“One engineer knows the system. If they leave, we're blind.”
Two-senior pairing, ADRs same day, runbooks. Two senior engineers paired daily. Every decision in an ADR. Every alert links to a runbook. Bus factor goes to four.
- 08
“The backup runs. We've never tested a restore. A real outage would be career-ending.”
DR drill on the calendar, RTO and RPO documented. Restore rehearsed quarterly. RTO and RPO written down and tested. Restore in under four hours, proven, not promised.
The stack we ship every observability implementation on.
OpenTelemetry as the wire format. Datadog by default, vendor-neutral by design. The tooling that means your next on-call engineer is productive on day one.
T1
What we build observability on
OpenTelemetry-firstOpenTelemetryDatadog APMGrafanaPrometheusSentryPagerDutyNode.js + ExpressPython (FastAPI)TypeScriptPostgreSQLGitHub ActionsTerraform
T2
When your brief calls for it
reach when neededHoneycombNew RelicGrafana LokiGrafana TempoJaegerVanta / Drata
T3
The infrastructure for scale
AWS-defaultAWSCloudWatchKubernetes (EKS)DockerAWS LambdaRedisApache KafkaOpenSearchAWS X-RayGuardDutyAWS BackupVault
Results
Helena's platform,
Helena's platform,
after the rebuild, in numbers
We rebuilt a blind V1 into an acquirer-defendable platform: OpenTelemetry traces, structured logs correlated, SLO dashboards, symptom alerts, cost tags, and an evidence pipeline wired Day 1.
Incidents
<60s
Time-to-cause from trace
0
Production incidents post-ship
The deal
12 wk
In-house to defendable
Full
Team retention, deal at ask
Track record
22
Implementations since 2019
SOC 2
Type 1 in 9 weeks
Audit first, then sprint.
The honest order. A fixed-price audit bounds the risk before any code ships, then a fixed-scope sprint delivers it.
5-day audit
Two senior engineers read your estate and brief, then write it all down.
- 30-page written brief
- Six ADRs + risk matrix
- Fixed-price quote for the sprint
- You decide whether to continue
The sprint
8 to 14 weeks of fixed-scope shipping. Audit-led, evidence-first, observable.
- OpenTelemetry instrumentation
- SLO dashboards + symptom alerts
- Runbooks + incident tooling
- Multi-cloud comfortable
Retainer
One day a week of a senior engineer for three to six months.
- Performance + cost tuning
- New surface observability
- On-call coaching
- Your team gets unblocked
“The acquirer's CTO walked the same surface twice. The second time, he signed full-team retention.”
What CTOs actually ask before signing
Pain-first, soft-second.
The audit is £8K fixed. The sprint is typically £25K to £75K fixed-price, scoped at the end of the audit so you see the number before you commit. No day-rate, no scope creep. The retainer, if you want one, runs from £5K a month.
OpenTelemetry is the wire format your code emits, always. Datadog is our default backend, but we ship Grafana, Honeycomb, and New Relic just as happily. You don't have to switch off your current vendor. Because instrumentation is vendor-neutral, switching later is a config change, not a re-instrumentation project.
No. We work in-place wherever possible. Any migration is scoped at the audit if you want it, and old plus new run in parallel until you sign off. Most observability implementation work is additive: we instrument what you already run.
Yes, this is half of every observability implementation we do. We tune sampling, set retention tiers, and attribute cost per workload with tags and budget alerts. The bill typically stabilises within 30 days, and you keep the signal that actually matters.
An ADR pack, an audit log per mutation, the evidence pipeline, and a SOC 2 Type II stance. The acquirer's CTO walks the surface and signs full-team retention. That's happened three times across 2024 and 2025, deals closed at ask.
Every engagement has two senior engineers paired, not one. Every decision goes into an ADR the same day, and every alert links to a runbook. Mohit reviews every PR. Two handovers in seven years, both inside 48 hours. Your bus factor is four, not one.
Yes. AWS is the default. We've shipped on GCP, Azure, Cloudflare, DigitalOcean, Vercel, and Fly.io. The multi-cloud lock-in path is documented so you're never trapped. OpenTelemetry makes the observability layer portable across all of them.
30-day walk-away both ways. You keep everything and IP assigns on every commit. UK VAT registered, listed on Companies House, shipping since 2019. The audit is a fixed £8K so you're never more than 5 days at risk before you decide to continue.
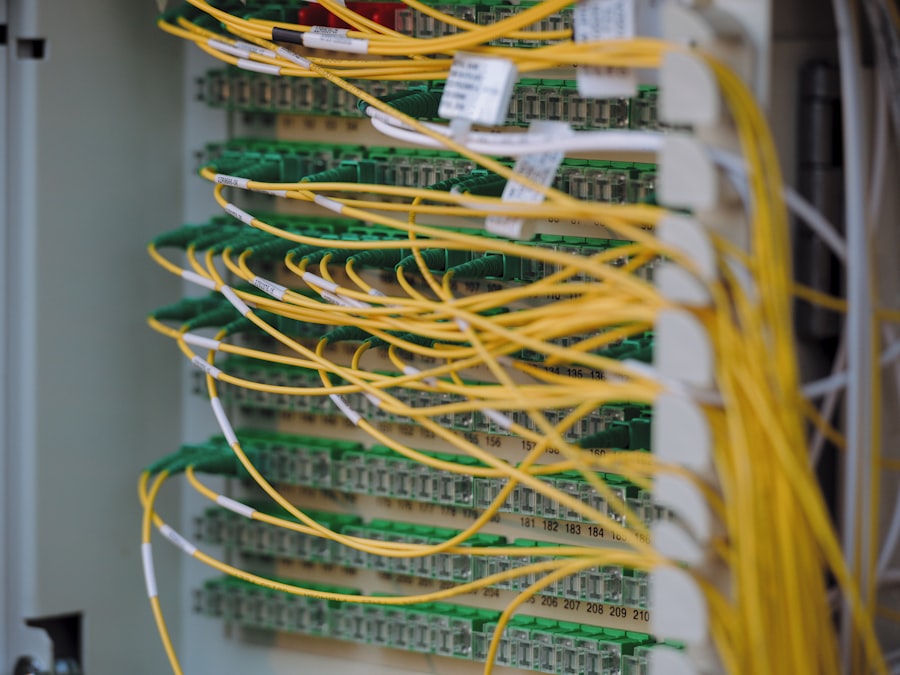
In context
What it looks like shipped.
observability implementation, in context — the dashboards, flows and components your team actually ships, reviews and maintains.
One paragraph. That's it.
Tell us your current estate, your deadline, and the outcome you want. Mohit replies inside 24 hours: a clear yes, a clear no, or the one question that decides it, plus the next audit slot.
What happens after the email lands
- < 24h
A personal reply.
Yes, no, or the deciding question. Straight to your inbox.
- Day 5
Audit brief in hand.
30 pages, six ADRs, a risk matrix, and a fixed-price quote for the sprint.
- Wk 8+
On-call reads the trace.
OTel, SLO dashboards, symptom alerts. An incident gets diagnosed in 60 seconds.